Blog
April 2024 Market Commentary
6 minutes

For the period March 1 – March 31, 2024.
Executive Summary
Equity markets continue to march higher despite the historic duration of the inverted U.S. Treasury yield curve. Inflation has moderated and stabilized, while growth expectations have modestly improved, indicating that risks between inflation and economic growth are well-balanced.
What Piqued Our Interest
The yield curve is said to be inverted when short-term Treasury yields exceed long-term yields. Traditionally, such an event is viewed as a sign that the U.S. economy will slip into recession in the near future.
On July 5, 2022, the yield on the 2-year Treasury eclipsed the yield on the 10-year Treasury and has remained this way since. As of March 29, 2024, the yield curve has been inverted for 454 trading days—the longest stretch in 40 years. According to the San Francisco Fed, the average time lag between when an inverted yield curve emerges and when a recession begins is 12 to 24 months. Since 1978, the longest delay between a yield curve inversion and the start of a recession was 22 months, while the shortest lag was six months.
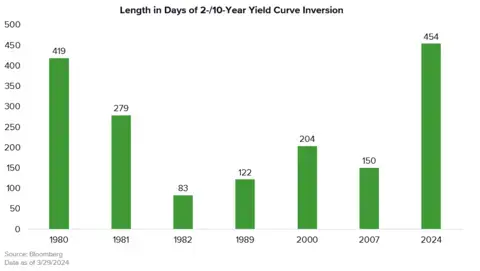
Despite this signal from the bond market, debates about whether the economy would experience a “soft” or “hard” landing recession have faded into the background as risk assets continue to reach new highs. Economic data reinforced the strength of the U.S. economy, with indicators such as the Conference Board’s leading economic indicators showing a positive (0.1%) month-over-month increase after 24 consecutive months of negative readings. Additionally, the most recent Institute for Supply Management (ISM) survey, released on April 1, showed the manufacturing index back above 50, which typically signals that the economy is expanding.
This upturn in economic data has been accompanied by some strengthening in pricing power and higher-than-expected inflation data. In March, the headline Consumer Price Index (CPI) increased 3.2%, and the Fed’s preferred inflation gauge, the core Personal Consumption Expenditures (PCE) Index (which excludes food and energy) rose 2.8%. Since these inflation prints are still above the Fed’s target of 2%, the Fed believes it is prudent to keep rates at the current level of 5.25 – 5.50% as they look for further evidence that inflation is heading towards their target. Rates need to be restrictive enough to keep pressure on inflation but not so restrictive that it stresses credit markets and economic growth. So far, the current level of interest rates seems to be accomplishing this very difficult task.
Once the Federal Reserve does embark on a reduction in interest rates, it should be viewed as a normalization of monetary policy and not the start of an easing cycle. This normalization in policy may be what eventually reverses the inverted yield curve, and if the economy and labor markets can remain strong, the yield curve inversion signal will be one of the few times we escape a recession.
Market Recap
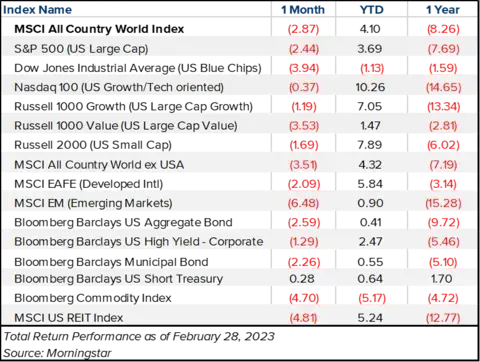
Equities continued their momentum in March, and markets saw a broadening in stocks participating in new highs. This was evidenced by the Russell 1000 Value Index outpacing its Growth counterpart in the month and generating year-to-date returns of 9.0%, slightly better than the 8.7% returns of the Tech-heavy Nasdaq 100. Given the strength in economic data, cyclical sectors saw some strength, with year-to-date returns for the Energy sector up 13.7% and Financials up 12.5%. Small Caps also had a strong month, with the Russell 2000 up 3.6%, bringing the year-to-date returns to 5.8%. Developed International stocks were also positive, up 3.3% with strength from Japanese stocks, which constitute over 20% of the index.
In fixed income, the U.S. Aggregate Bond Index was up 0.9%, with Treasury yields across 5- to 10-year maturities all near 4.3%. Municipal bonds were flat for the month, while the U.S. short Treasuries were up 0.4%, and U.S. high-yield did well, with a return of 1.2% in March. Commodities rebounded after a slow start to the year, with strength seen in oil, gold, and copper. The MSCI U.S. REIT Index also rebounded in March but remains negative for the year as high interest rates continue to be a headwind.
Closing Thoughts
The Fed has indicated that higher rates are out of the picture for now. This is good for both equity and fixed income markets. However, this is also why there is so much attention on the path of inflation, as the longer it takes for inflation to lower to the Fed’s 2% target, the longer rates will remain at current levels, which increases the risk of stress in credit markets.
We remain cautiously optimistic on the “soft-landing” scenario but it’s important to note that short-term swings in the market are always possible. Equity markets are showing little signs of stress, and while we can’t predict how markets will perform in the short term, over the long run, we know that stocks have considerable upside. Fixed income markets have been challenged lately but should perform better as rates decline this year. As always, maintaining a balanced portfolio is key for investing to meet one’s financial goals.

Insights
Related resources for you
Get the latest wealth management tips and trends from our library of articles and resources.